Microsoft Excel is one of the most popular tools for organizing and managing data. Whether you’re preparing a monthly budget, tracking sales, maintaining employee records, or simply creating a list of names, Excel makes the job much easier.
One of Excel’s most useful features is Tables. Although they may look like ordinary data ranges, Excel Tables offer powerful tools that make data management faster, smarter, and more organized.
Whether you’re tracking sales, maintaining employee records, managing inventory, or creating a monthly budget, Excel Tables can significantly improve the way you work.
In this guide, you’ll learn what an Excel Table is, why it’s useful, how to create one, and the features that make it an essential tool for every Excel user.

What is a Table in Excel?
Think of an Excel Table as a smarter version of a normal data range.
Normally, when you enter data into a worksheet, Excel treats it as ordinary cells. If you want to sort the data, apply filters, or calculate totals, you’ll often need to do those tasks manually.
When you convert that same range into an Excel Table, Excel automatically adds several built-in features that make working with your data much easier.
Some of the most useful features include:
- Ready-made formatting styles.
- Easy sorting and filtering.
- Automatic expansion when you add new rows or columns
- Simple, readable formulas with column names instead of cell references.
- A Total Row for quick calculations like SUM, AVERAGE, COUNT, MAX, and MIN
- Easy integration with PivotTables, Charts, and Power Query.
For example, imagine you’re maintaining a list of monthly sales. Every month, you’ll keep adding new records. If you’re using a normal data range, you may need to update formulas, formatting, and filters manually.
With an Excel Table, those updates happen automatically. As soon as you add a new row, the table expands, formulas continue to work, and the formatting stays consistent.
That’s why Excel Tables are one of the first features every beginner should learn.
How to Create a Table in Excel:
Creating a table in Excel is surprisingly easy. Once your data is ready, it only takes a few clicks to convert it into a fully functional table.
There are three different ways to create a table in Excel. All of them produce the same result, so you can use whichever method you find most convenient.
Method 1: Using the Insert Tab:
This is the most common and beginner-friendly method.
- Select the range of data you want to convert into a table.
- Example: A1:D10
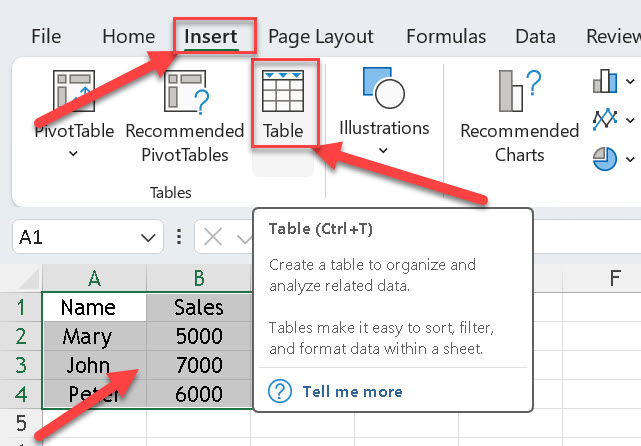
- Go to the Insert tab on the Ribbon.
- Click Table in the Tables group.
- Excel displays a dialog box showing the selected data range.
- If your data already contains column headings, check the My table has headers option.
- Click OK.
That’s it! Your data is now an Excel Table. You’ll notice that Excel automatically applies a table style and adds filter buttons to each column header.
Method 2: Using the Keyboard Shortcut:
If you enjoy using keyboard shortcuts, this is the fastest way to create a table.
- Select your data range.
- Press Ctrl + T on your keyboard.
- Check My table has headers if your data includes column names.
- Click OK.
Your table will be created instantly.
This shortcut is a favorite among Excel users because it saves time and avoids navigating through the Ribbon.
Method 3: Using Format as Table:
You can also create an Excel Table from the Home tab.
- Select your data.
- Go to the Home tab.
- In the Styles group, click Format as Table.
- Choose your preferred table style.
- Confirm the selected range.
- Select My table has headers if your data contains column names.
- Click OK.
Your data is now converted into an Excel Table with the style you selected.
Which Method Should You Choose?
All three methods create the same type of Excel Table. The only difference is how you start the process.
| Method | Best For |
| Insert → Table | Best for beginners |
| Ctrl + T | Fastest method for regular Excel users |
| Home → Format as Table | Create a table while choosing a built-in style |
If you’re just starting with Excel, I recommend using the Insert tab because it’s simple and easy to remember. As you become more comfortable with Excel, you’ll probably find yourself using Ctrl + T most of the time.
Step-by-Step Example:
Let’s create a simple Excel Table using a small dataset.
Step 1: Prepare Your Data:
Start by entering your data in rows and columns.
Make sure:
- Every column has a heading.
- There are no completely blank rows or columns inside the data.
- Each column contains similar types of information.

Step 2: Select the Data Range:
Click and drag to select the entire dataset, including the headers.
For this example, the selected range is A1:C4.
Step 3: Insert the Table:
Go to the Insert tab and click Table.
You can also press Ctrl + T if you prefer using shortcuts.
Step 4: Confirm the Table Range:
Excel opens the Create Table dialog box.
Double-check that the correct range is selected. If your data already includes column names, make sure the My table has headers checkbox is selected.
Click OK.

Step 5: Your Table Is Ready:
Congratulations! Your data has now been converted into an Excel Table.

You’ll immediately notice a few changes:
- A professional table style is applied.
- Filter buttons appear in each column header.
- Your table is ready for sorting, filtering, formulas, and many other powerful features.
Key Features of Excel Tables:
Once you’ve created a table, you’ll notice that Excel offers several built-in features designed to make your work easier. These features help you organize data, perform calculations, and analyze information without spending extra time on manual tasks.
Let’s explore each feature one by one.
1. Table Styles:
One of the first things you’ll notice after creating a table is that Excel automatically applies a professional-looking design. Instead of plain rows and columns, your data becomes much easier to read.
If you want to change the appearance, select any cell in the table. A new Table Design tab (called Table in some Excel versions) appears on the Ribbon.
From here, you can choose from a variety of built-in table styles.
You can also customize the table using options such as:
- Header Row – Displays the column headings.
- Total Row – Adds a row at the bottom for quick calculations.
- Banded Rows – Alternates row colors, making large tables easier to read.
- Banded Columns – Applies alternating colors to columns.
- First Column – Highlights the first column.
- Last Column – Highlights the last column.
These formatting options not only make your worksheet look more professional but also improve readability, especially when working with large datasets.

2. Sorting and Filtering:
Imagine you have hundreds of employee records or sales transactions. Finding specific information manually can take a lot of time.
Excel Tables solve this by automatically adding filter buttons to every column header.
Click the drop-down arrow beside any header, and you’ll see options to:
- Sort text from A to Z or Z to A.
- Sort numbers from Smallest to Largest or Largest to Smallest.
- Filter the table to display only the records you need.
- Search for specific values within that column.
For example, if you’re maintaining a sales report, you can quickly display only one salesperson’s records or sort sales amounts from highest to lowest in just a few clicks.
This makes analyzing large datasets much faster and more convenient.

3. Total Row:
Calculating totals is something almost everyone does in Excel. Normally, you’d need to write formulas like SUM, AVERAGE, or COUNT yourself.
With Excel Tables, there’s a much easier way.
Simply select any cell in the table, go to the Table Design tab, and enable the Total Row option.
Excel adds a new row at the bottom of the table where you can instantly calculate values such as:
- SUM
- AVERAGE
- COUNT
- MAX
- MIN
- STANDARD DEVIATION
- VARIANCE
Just click the drop-down arrow in the Total Row and choose the function you need. Excel performs the calculation automatically.

This is especially useful when you’re working with sales reports, expenses, attendance records, or any dataset that requires quick summaries.
4. Structured References:
This is one of the smartest features of Excel Tables, although beginners often overlook it.
Normally, formulas use cell references like this:
=SUM(B2:B15)
While this works, it can become confusing when your worksheet grows larger.
Excel Tables allow you to use column names instead of cell references.
For example:
=SUM(Table1[Sales])
Even if you add new rows to the table later, the formula automatically includes the new data.
Because the formula uses meaningful column names, it’s much easier to understand and maintain.
If you share your workbook with someone else, they’ll also find these formulas much easier to read.
5. Automatic Expansion:
One of the biggest advantages of using Excel Tables is that they grow along with your data.
Suppose you’ve created a table containing monthly sales. Next month, you simply type the new record in the row immediately below the table.
Instead of treating it as separate data, Excel automatically expands the table to include the new row.
The same happens when you add a new column beside the table.
Not only does the table expand automatically, but Excel also extends the formatting and, in many cases, copies formulas to the new rows.
This means you don’t have to adjust ranges or reapply formatting every time your data grows.
It’s a small feature, but one that saves a surprising amount of time in everyday work.
Pro Tip:
If you regularly update reports by adding new records, always use Excel Tables instead of a normal data range. Features like automatic expansion, structured references, and built-in filtering can save you a lot of repetitive work and help reduce mistakes.
Common Things You Can Do with Tables:
Once you start using Excel Tables, you’ll realize they’re much more flexible than a normal range of cells. As your data changes, you can easily add new records, remove unwanted information, rename tables, or even convert them back into a regular data range.
Let’s look at some of the most common tasks you’ll perform while working with Excel Tables.
Adding or Removing Rows and Columns:
As your data grows, you’ll often need to add new records or insert additional columns. The good news is that Excel Tables make this process effortless.
Adding a New Row:
Simply start typing in the row immediately below the table.
As soon as you press Enter, Excel automatically expands the table to include the new row. The formatting, filters, and formulas are applied automatically, so you don’t have to do anything extra.
Adding a New Column:
Need to store more information?
Type a new column heading in the cell next to the last column of the table. Excel automatically extends the table and includes the new column.
Removing Rows or Columns:
If you no longer need certain data, simply:
- Right-click the row or column.
- Choose Delete.
- Select the appropriate delete option.
Excel updates the table instantly while keeping the remaining data properly organized.
Converting Table Back to Range:
There may be times when you no longer need the special features of an Excel Table. In such cases, you can easily convert it back into a regular cell range.
Here’s how:
- Select any cell in the table.
- Go to the Table Design tab.
- Click Convert to Range.
- Click Yes to confirm.
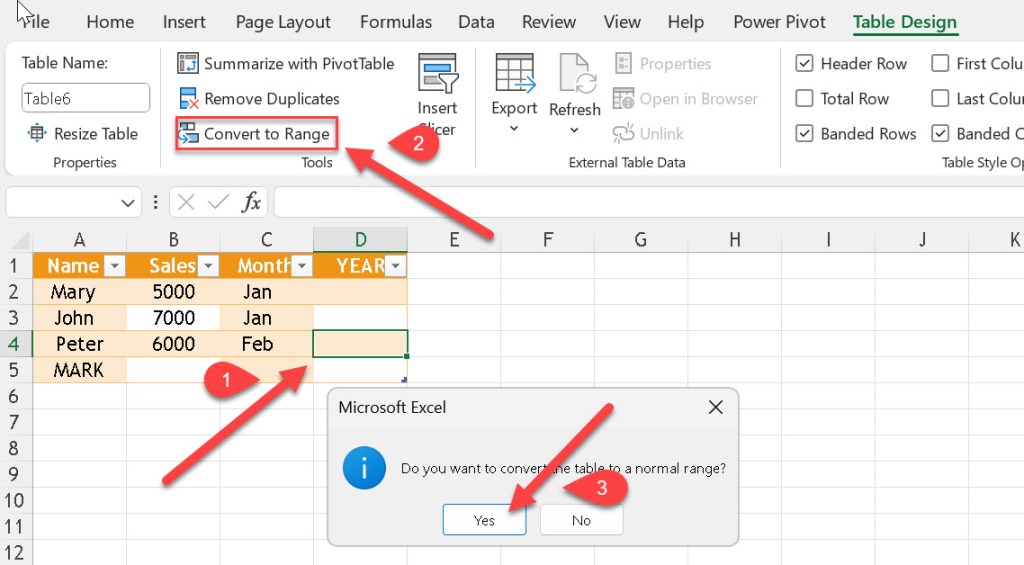
Your data remains exactly as it is, but the table functionality, such as automatic filters and structured references, is removed.
Note: The formatting usually remains even after converting the table to a normal range. If you want to remove the formatting as well, you can clear the cell styles separately.
Renaming a Table:
When you create a table, Excel automatically assigns it a default name like Table1, Table2, or Table3.
While these names work, they aren’t very descriptive, especially if your workbook contains multiple tables.
Giving your table a meaningful name makes formulas and data management much easier.
For example:
EmployeeData
SalesReport
ProductList
MonthlyExpenses
To rename a table:
- Select any cell in the table.
- Go to the Table Design tab.
- In the Table Name box, enter a new name.
- Press Enter.

From now on, Excel will use the new name whenever you create formulas using structured references.
Benefits of Using Tables in Excel:
You might be wondering, “Why should I convert my data into a table when I can simply use rows and columns?”
The answer is simple. Excel Tables help you work more efficiently and reduce manual effort.
At first glance, Excel Tables may seem like they’re only meant to improve the appearance of your data. However, they offer much more than just formatting.
Here are some of the biggest benefits you’ll notice when using Excel Tables regularly:
- Keep your data neat and well organized.
- Apply professional formatting instantly.
- Sort and filter information with just a few clicks.
- Automatically include new rows and columns as your data grows.
- Write easier-to-understand formulas using column names instead of cell references.
- Quickly calculate totals without creating formulas from scratch.
- Create PivotTables and charts more easily.
Whether you’re managing a small list or a large business dataset, Excel Tables help you work faster, stay organized, and reduce errors.
Best Practices for Using Excel Tables:
To get the best results, it’s worth following a few simple best practices.
- Always use clear and unique column headings.
- Avoid blank rows and blank columns within the table.
- Keep similar types of data in the same table.
- Rename tables if you’re working with multiple tables in the same workbook.
- Use structured references instead of traditional cell references whenever possible.
- Regularly review your filters to make sure you’re seeing all the data you need.
Following these habits will make your worksheets easier to maintain as they grow.
Pro Tip:
If you’re building dashboards, reports, or PivotTables, it’s a good practice to convert your data into an Excel Table first. Since tables automatically expand when new data is added, your reports and analyses are much easier to update without adjusting cell ranges manually.
Frequently Asked Questions (FAQs):
1. What is a table in Excel?
An Excel Table is a structured range of data that comes with built-in features like sorting, filtering, automatic formatting, structured references, and automatic expansion. It helps you organize and manage data more efficiently than a normal range of cells.
2. What is the shortcut to create a table in Excel?
The keyboard shortcut is Ctrl + T.
After selecting your data, press Ctrl + T, verify the data range, check My table has headers if your data includes column names, and click OK.
3. What’s the difference between a normal data range and an Excel Table?
A normal data range is simply a collection of cells containing information.
An Excel Table, on the other hand, automatically provides features such as:
- Built-in sorting and filtering
- Professional formatting
- Automatic expansion
- Structured references
- Total Row calculations
These features make working with data much easier, especially as your dataset grows.
4. Can I convert an Excel Table back to a normal range?
Yes.
Select any cell in the table, go to the Table Design tab, click Convert to Range, and confirm your choice.
Your data will remain the same, but the table features will be removed.
5. Does an Excel Table expand automatically?
Yes.
When you add new rows or columns next to the table, Excel automatically extends the table to include the new data. In many cases, it also copies the existing formatting and formulas.
6. Can I change the design of an Excel Table?
Absolutely.
Select any cell in the table, open the Table Design tab, and choose a different table style. You can also enable options like Banded Rows, Total Row, First Column, and Last Column to customize its appearance.
7. Why should I use Excel Tables instead of a normal range?
Excel Tables save time by automating many everyday tasks. They make sorting, filtering, calculating totals, and managing growing datasets much easier. If you regularly work with lists, reports, or business data, using tables can significantly improve your productivity.
Excel Tables are one of the simplest yet most powerful features in Microsoft Excel. While they may look like ordinary rows and columns, they offer much more than just better formatting.
With features like automatic expansion, built-in sorting and filtering, structured references, and quick calculations, tables help you organize data more efficiently and reduce manual work.
If you’re new to Excel, learning how to use tables is one of the best investments you can make. It’s a feature you’ll use in everything from simple personal budgets to advanced business reports.
The more you work with Excel Tables, the more you’ll appreciate how much time they save and how much easier they make data management.
So the next time you create a list in Excel, don’t leave it as a normal range. Convert it into a table and let Excel do some of the hard work for you.
What’s Next?
Now that you’ve learned the basics of Excel Tables, here are a few related topics you may want to explore next:
Conditional Formatting in Excel
Excel Formulas and Functions for Beginners
Creating PivotTables in Excel
Mastering these features will help you become more confident and productive in Excel.